Note
Click here to download the full example code
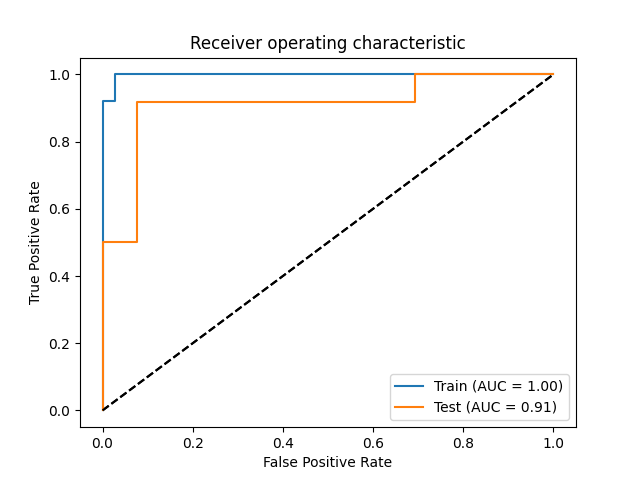
Plot ROC (Receiver operating characteristic)
Given a trained model, it showcase the Area under the curve of both train and test data.
from sklearn import datasets, model_selection, svm

from dfds_ds_toolbox.analysis.plotting import plot_roc_curve

X, y = datasets.make_classification(random_state=0)
X_train, X_test, y_train, y_test = model_selection.train_test_split(X, y, random_state=0)
clf = svm.SVC(random_state=0, probability=True)
clf.fit(X_train, y_train)

y_pred_train = clf.predict_proba(X_train)[:, 1]
y_pred_test = clf.predict_proba(X_test)[:, 1]

fig = plot_roc_curve(y_true=y_train, y_pred=y_pred_train, label="Train")
ax = fig.get_axes()[0]
fig = plot_roc_curve(y_true=y_test, y_pred=y_pred_test, label="Test", ax=ax)
Total running time of the script: ( 0 minutes 0.151 seconds)