Contents:
Galleries:
Below is a gallery of example plots in dfds_ds_toolbox.
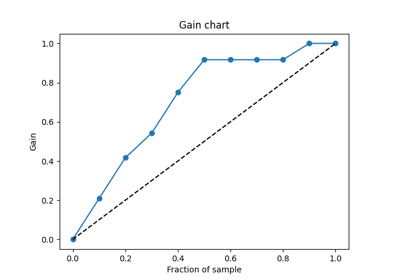
Plot Gain chart
Plot Lift curve
Plot ROC (Receiver operating characteristic)
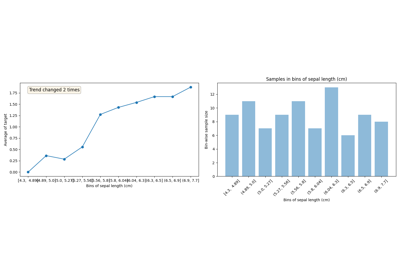
Univariate plots
Histogram of predicted probabilities
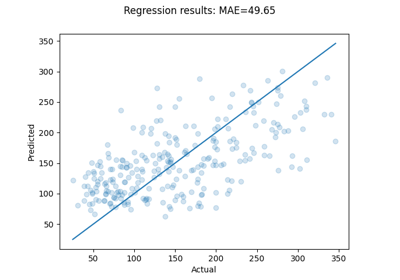
Regression results (Pred vs Real)
Gallery generated by Sphinx-Gallery