Note
Click here to download the full example code
Univariate plots
For a list of features separate in bins and analysis the target distribution in both Train and Test


Out:
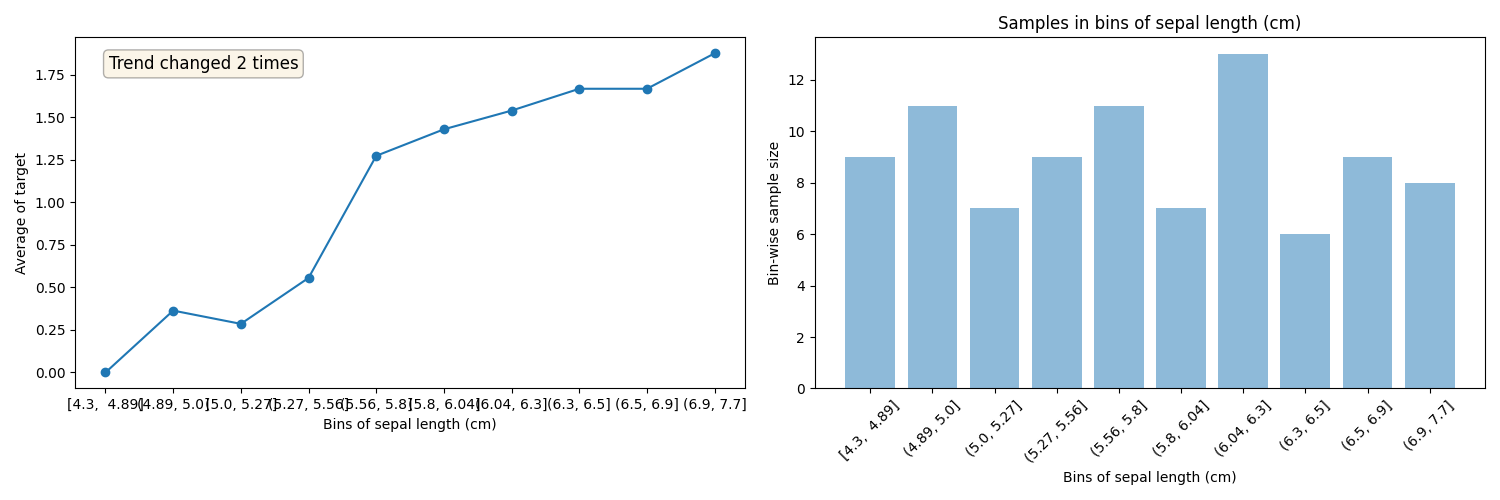
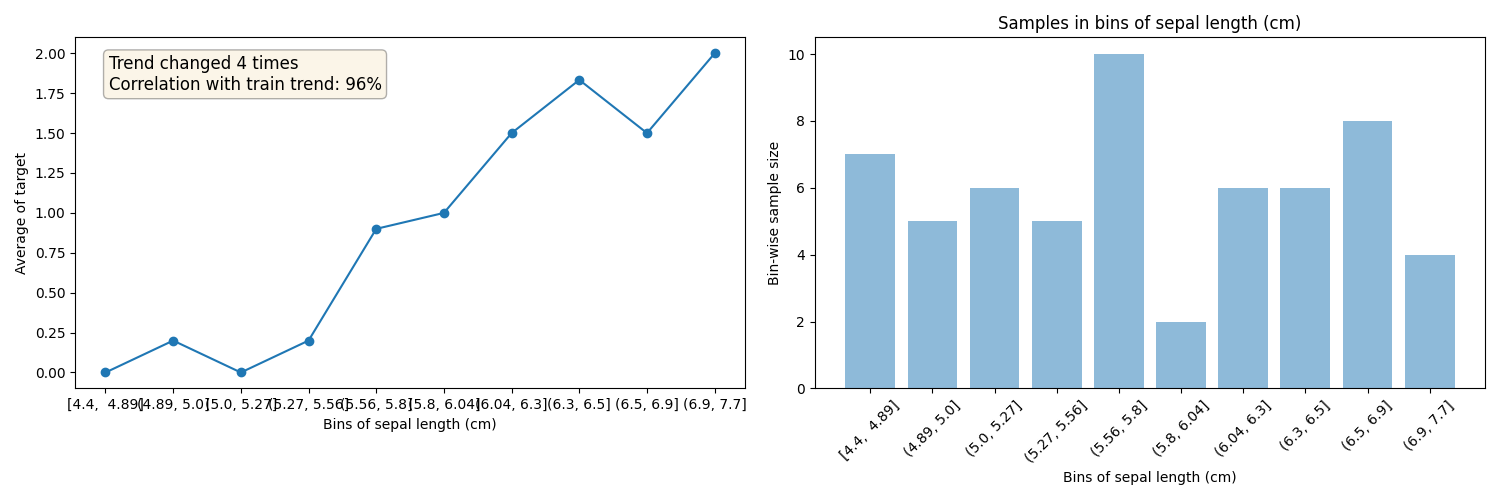
Plots for sepal length (cm)
Train data plots
Test data plots
Plots for sepal width (cm)
Train data plots
Test data plots
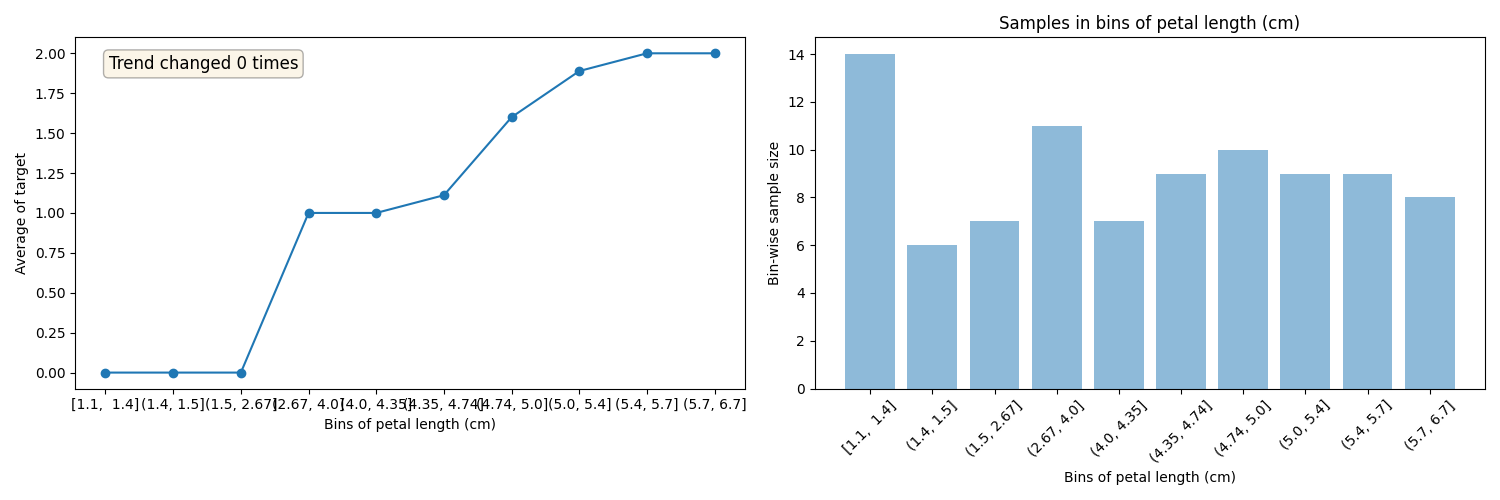
Plots for petal length (cm)
Train data plots
Test data plots
Plots for petal width (cm)
Train data plots
Test data plots
from sklearn.datasets import load_iris
from sklearn.model_selection import train_test_split

from dfds_ds_toolbox.analysis.plotting import plot_univariate_dependencies

# Create a dataset to classify
X, y = load_iris(return_X_y=True, as_frame=True)
features = list(X.columns)
X_train, X_test, y_train, y_test = train_test_split(X, y, test_size=0.4, random_state=42)
data_train = X_train.copy()
data_train["target"] = y_train

data_test = X_test.copy()
data_test["target"] = y_test

# plots univariate plots of first 10 columns in data_train
plot_univariate_dependencies(
    data=data_train, target_col="target", features_list=features, data_test=data_test
)
Total running time of the script: ( 0 minutes 2.881 seconds)